[Visualization widgets]
Object Functions
Chart object. You can choose to display it as a histogram or a line graph.
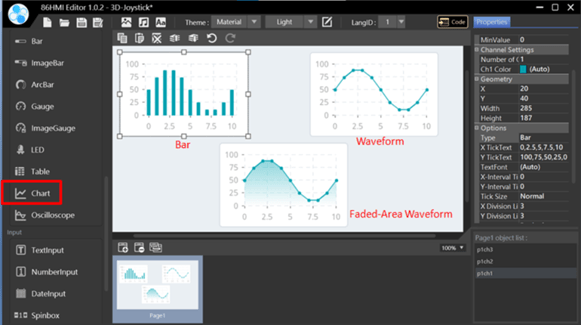
Chart Properties.
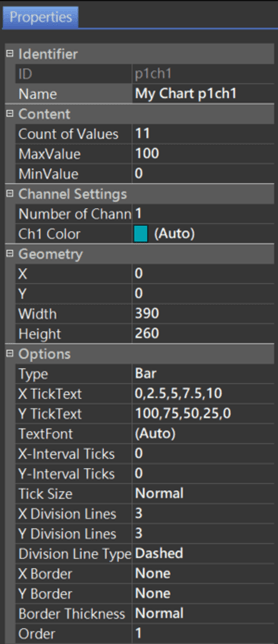
Identifier:
- ID: Unique number that identifies the object.
- Name: User-definable name for the object. It can be used with 86HMI API.
Content:
- Count of Values: Data count.
- MaxValue: Maximum value of vertical axis.
- MinValue: Minimum value of vertical axis.
Channel Settings:
- Number of Channels: Channel number, up to 4.
- Ch1~4 Color: Each channel color. It can be chosen through the color palette or by directly inputting the color code.
Geometry:
- X: Object X coordinate.
- Y: Object Y coordinate.
- Width: Object width.
- Height: Object height.
Options:
- Type: Chart type.
- Bar (顯示條)
- Waveform
- Faded-area-Waveform
- X TickText: X tick text. Display the position and entry number evenly.
- Y TickText: Y tick text. Display the position and entry number evenly. You filled in the values in order from the upper limit.
補充說明:
If you press Auto at the bottom of the fill-in window, the value will be assigned according to the user-defined Count/MaxValue value, and the displayed value will be divided into 5 positions, and the values of the 5 positions will be assigned in equal proportion.
- TextFont: Choose from 6 default font styles. For font configuration instructions, please refer to Theme Management.
- X Interval Ticks: X interval ticks.
- Y Interval Ticks: Y interval ticks.
- Tick Size: Tick size, with options as None, Normal, and Large.
- X Division: X grid number.
- Y Division: Y grid number.
- Division Line Type: Division Line Type, with options as None (no grid), Solid (solid line), and Dashed (dashed line).
- X Border: X border.
- Y Border: Y border.
- Border Thickness: Border thickness.
- Order: Object order. It can adjust the object order by up/down, which can be viewed on the Object List.
API Functions
setChartValue()
描述
Set Chart Value.
語法
void setChartValue(lv_obj_t* id, int channel, int index, int value);
void setChartValue(char* name, int channel, int index, int value);
參數
[in] id
Object ID.[in] name
Object Name.[in] channel
Chart Channel.[in] index
Chart Index.[in] value
The value of the Chart Channel.
Return
無
範例
#include "myhmi.h"

void setup() {
  Hmi.begin();
  // ...
  Hmi.setChartValue(p1ch1, 0, 1, 100);
  Hmi.setChartValue(p1ch1, 0, 2, 75);
  Hmi.setChartValue(p1ch1, 0, 3, 50);
  Hmi.setChartValue(p1ch1, 0, 4, 10);
  /// ...
}

void loop() {
  // ...
}
setChartValues()
描述
Set Chart all index value.
語法
void setChartValues(lv_obj_t* id, int channel, int* values);
void setChartValues(char* name, int channel, int* values);
參數
[in] id
Object ID.[in] name
Object Name.[in] channel
Chart Channel.[in] values
The values of the Chart Channel.
Return
無
範例
#include "myhmi.h"

int chartData[4] = {100, 75, 50, 10};

void setup() {
  Hmi.begin();
  // ...
  Hmi.setChartValues(p1ch1, 0, chartData);
}

void loop() {
  // ...
}
disableChartChannel()
描述
Disable Chart Channel.
語法
void disableChartChannel(lv_obj_t* id, int channel);
void disableChartChannel(char* name, int channel);
參數
[in] idObject ID.[in] name
Object Name.[in] channel
Chart Channel.
Return
無
範例
#include "myhmi.h"

void setup() {
  Hmi.begin();
  // ...
  Hmi.disableChartChannel(p1ch1, 0);
}

void loop() {
  // ...
}
enableChartChannel()
描述
Enable Chart Channel.
語法
void enableChartChannel(lv_obj_t* id, int channel);
void enableChartChannel(char* name, int channel);
參數
- [in] id
Object ID. - [in] name
Object Name. - [in] channel
Chart Channel.
Return
無
範例
#include "myhmi.h"

void setup() {
  Hmi.begin();
  // ...
  Hmi.enableChartChannel(p1ch1, 0);
}

void loop() {
  // ...
}
Please see the 86HMI Editor使用手冊 for more instructions on 86HMI widgets and API usage.